Analyze your data in dbt
Start with a stakeholder question and analyze the data to answer that question without writing any SQL
Introduction
As a data analyst, you play a key role in transforming complex data into trusted, actionable insights for your team. With dbt, you can use built-in, AI-powered tools to build governed data models, explore how they’re built, and even run your own analysis.
In this quickstart, you’ll learn how to:
- Use Catalog to browse and understand data models across both dbt and Snowflake data assets
- Use Insights to run queries for exploring and validating your data
- Use Canvas to visually build your own data models
- Build confidence using dbt as your workspace enhanced with AI
Here's more about the tools you will use on your journey:
- Catalog: View your project's resources (such as models, tests, and metrics), their lineage, and query patterns to gain a better understanding of its latest production state.
- Insights: Explore, validate, and query data with an intuitive, context-rich interface that bridges technical and business users by combining metadata, documentation, AI-assisted tools, and powerful querying capabilities.
- Canvas: Quickly access and transform data through a visual, drag-and-drop experience and with a built-in AI for custom code generation.
Prerequisites
Before you begin, make sure:
- You have access to and credentials configured for a dbt project
- Your team has already run a successful dbt job, so models are built and ready
- You have a a git provider connected and authenticated
Analyst workflows
Kimiko, an analyst at the Jaffle Shop, notices they've been doing a lot of new sales and wants to investigate the most critical data they have in their warehouse.
Question: A stakeholder is curious how many customers you've acquired month by month, in the last 12 months.
Kimiko wonders, "How do I find data in our project that will help me answer their question?"
Explore a stakeholder question
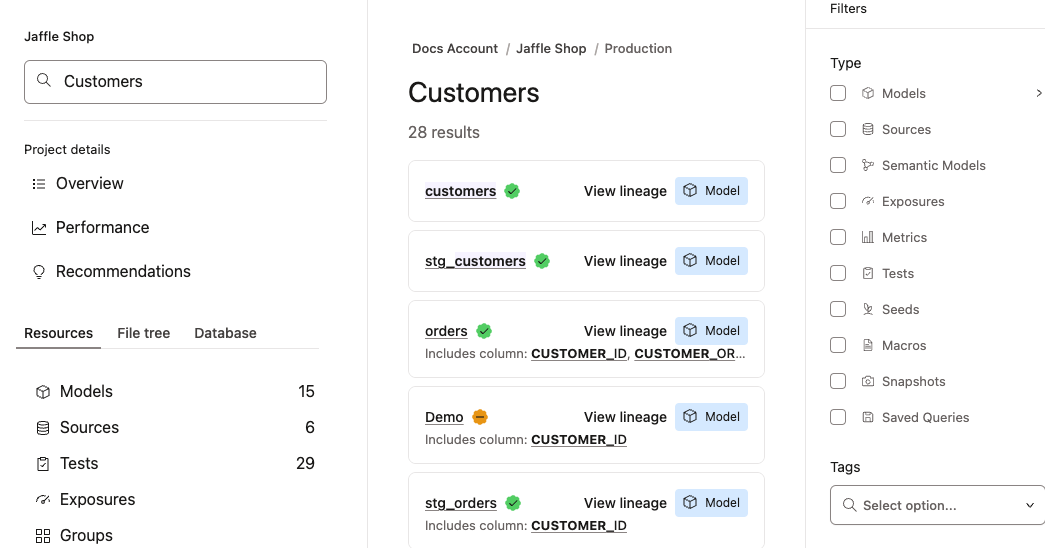
She navigates to the data catalog, Catalog, by signing into dbt and clicking Catalog in the left panel. Because the question was about customers, Kimiko begins by searching for "customers" in Catalog:
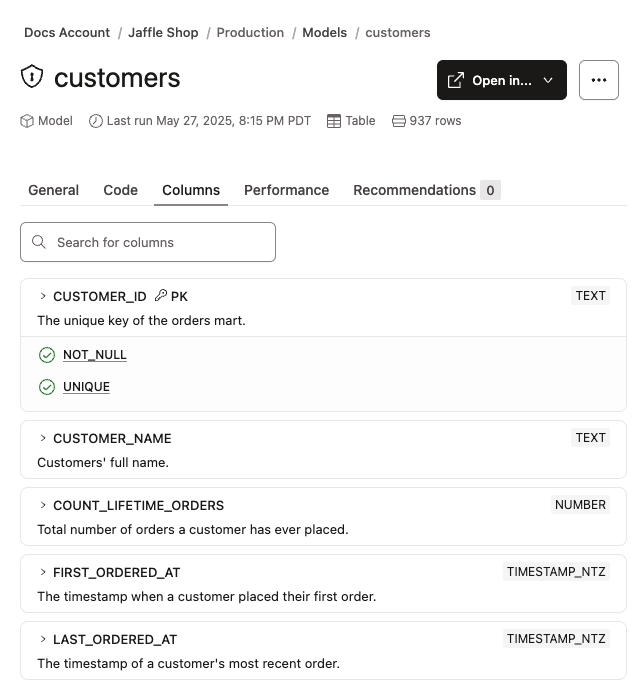
She finds a "customers" model, which might be what she needs. She clicks customers to open the model. The description reads, “Customer overview data Mart offering key details for each unique customer, one row per customer.”
Next, Kimiko selects Columns to see which columns this model uses.
She notices these columns: customer_ID, customer_names, and first_ordered_at.
The first_ordered_at column stands out to Kimiko, and she wonders if she might use it to see how many customers they've acquired based on when they placed their first order.
But first, she decides to interact with the data to learn more.
Query data in Insights
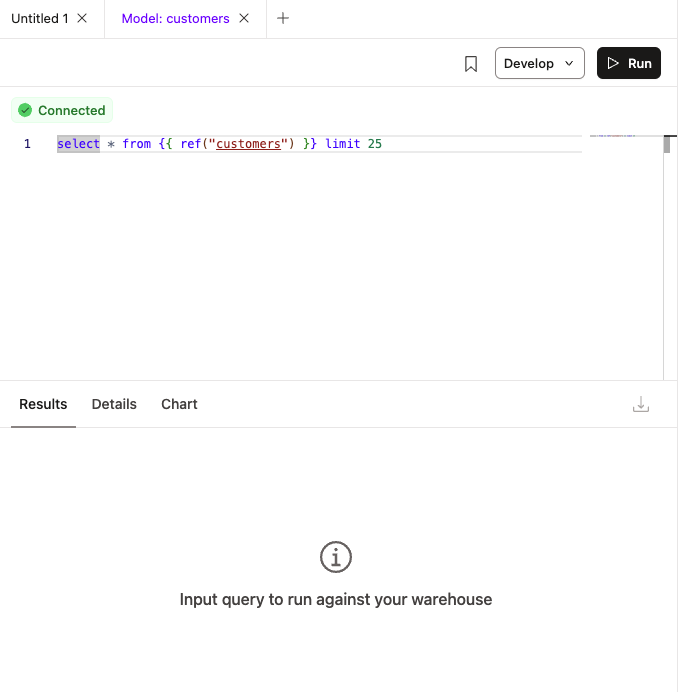
From the Customer model page in Catalog, Kimiko selects Analyze data from the Open in... dropdown. This enables her to query data for the Customer model. Once opened, Insights contains a query poised and ready to run.
When Kimiko runs the query, she can look at the data underyling it. The same context she saw in Catalog she now sees in her SQL editing experience.
As she looks through the data, she sees information about each customer. She also notices the first_ordered_at column. Kimiko wants to code the query but her SQL is a little rusty so she uses natural language in dbt Copilot:
How many new customers did we get in each month last year? I'd like to use my customer model and the first ordered at field to do this analysis.
dbt Copilot writes SQL that Kimiko decides to use:
select
    date_trunc('month', first_ordered_at) as month,
    count(customer_id) as new_customers
from {{ ref('customers') }}
where
    date_part('year', first_ordered_at) = date_part('year', current_date) - 1
    and customer_type = 'new'
group by 1
order by 1;
Kimiko clicks Replace to move all of the SQL into her editor and replaces the original query. She runs the new query and reviews the data but decides to limit the dates using Copilot once again:
Can we limit the dates to 2024?
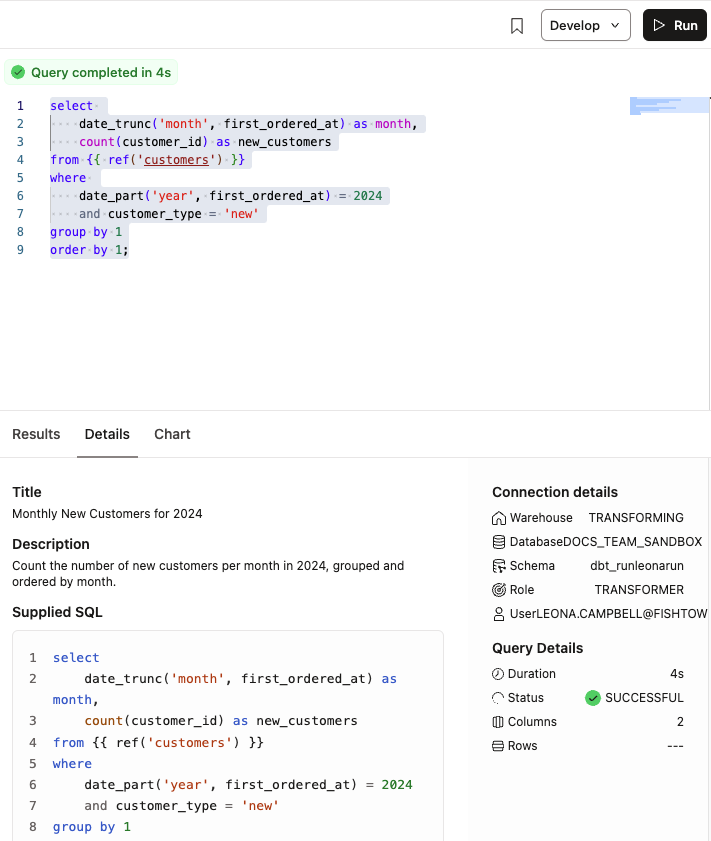
She verifies the new filter for 2024 and reruns this query:
select
    date_trunc('month', first_ordered_at) as month,
    count(customer_id) as new_customers
from {{ ref('customers') }}
where
    date_part('year', first_ordered_at) = 2024
    and customer_type = 'new'
group by 1
order by 1;
She's happy with the results and clicks Details to see the AI-generated report, which includes a title and description, supplied SQL, and the compiled SQL.
Once she's ready to get the insight to her stakeholder, she clicks Chart to view the chart prefilled with the data from the Results tab.
She adds x- and y-axis labels, such as "Month of first order" and "Total new customers" to make it more comprehensible for the final report she'll share with her stakeholder. Next, she takes a screenshot to share with them.
She often comes back to this data so Kimiko decides to bookmark the page by clicking Bookmark in the top right. She also exports it to a CSV file.
Visualize results
Kimiko has a few conversations with teammates and she finds out they're running pretty similar one-off queries, so she decides to take her long running query that she previously bookmarked and turn it into a full-fledged dbt model using Canvas. She does this so she can share it with others, which de-duplicates work and helps her team become more efficient.
To do this, she opens the query in Insights and clicks Develop then *Develop in Canvas. This opens the SQL query in a visual form, represented in a DAG.
When she examines the model, she notes it's selecting from customers as expected, filtering for 2024, showing dates by month, and aggregating over that month. She runs it in her development environment and clicks Commit to submit a pull request.
Now Kimiko's entire team, those who have the same access as her, can run this model and see the same results she does! What's more is they can help her improve the model as the stakeholder requests get more complicated, and she will benefit from their help.
The query becomes a model
Going forward, Kimiko is able to return to her project in Catalog and run the model to get the most current results. From here, she can:
- Manually run the model, which also runs tests and is versioned so Kimiko can track changes over time
- Trigger a scheduled job to run the dbt model, like every Monday for her stakeholder report
- Set up a Slack notification in case the job fails so she can recitfy any problems


